how to set up your log system
How to collect, manage and visualize our log data?
author: zengqiang fanglog ELK EFK k8s
Background
During our daily working, application status, the content of http request and response, exception message, etc, which are very useful to us for debugging online issues and monitoring applications. Therefore, it is necessary to collect log data and visualize log records as a chart. In the past, we recorded log information into logs file. Then, we logged to the server to check log information or downloaded log file. According to this way, it is not only very hard to analyze log in real time, but also it is too difficult to search or filter log by key words. Nowadays, more and more services and systems are deployed in k8s clusters. Therefore, it’s no hesitation to find a new way to collect and visualize data. In the article, we will introduce two k8s supported log frameworks, which are ELK and EFK. E has the same meaning for these two frameworks, ElasticSearch engine. L means the logstash, log agent. F is fluentd, k8s Nodes level log collecting application. And K also points to the same application, Kibana. It is used to visualize log. During the rest of this article, we will have a detailed description about what they are and how to use them.
Logs management frameworks
ELK ElasticSearch logstash kibana
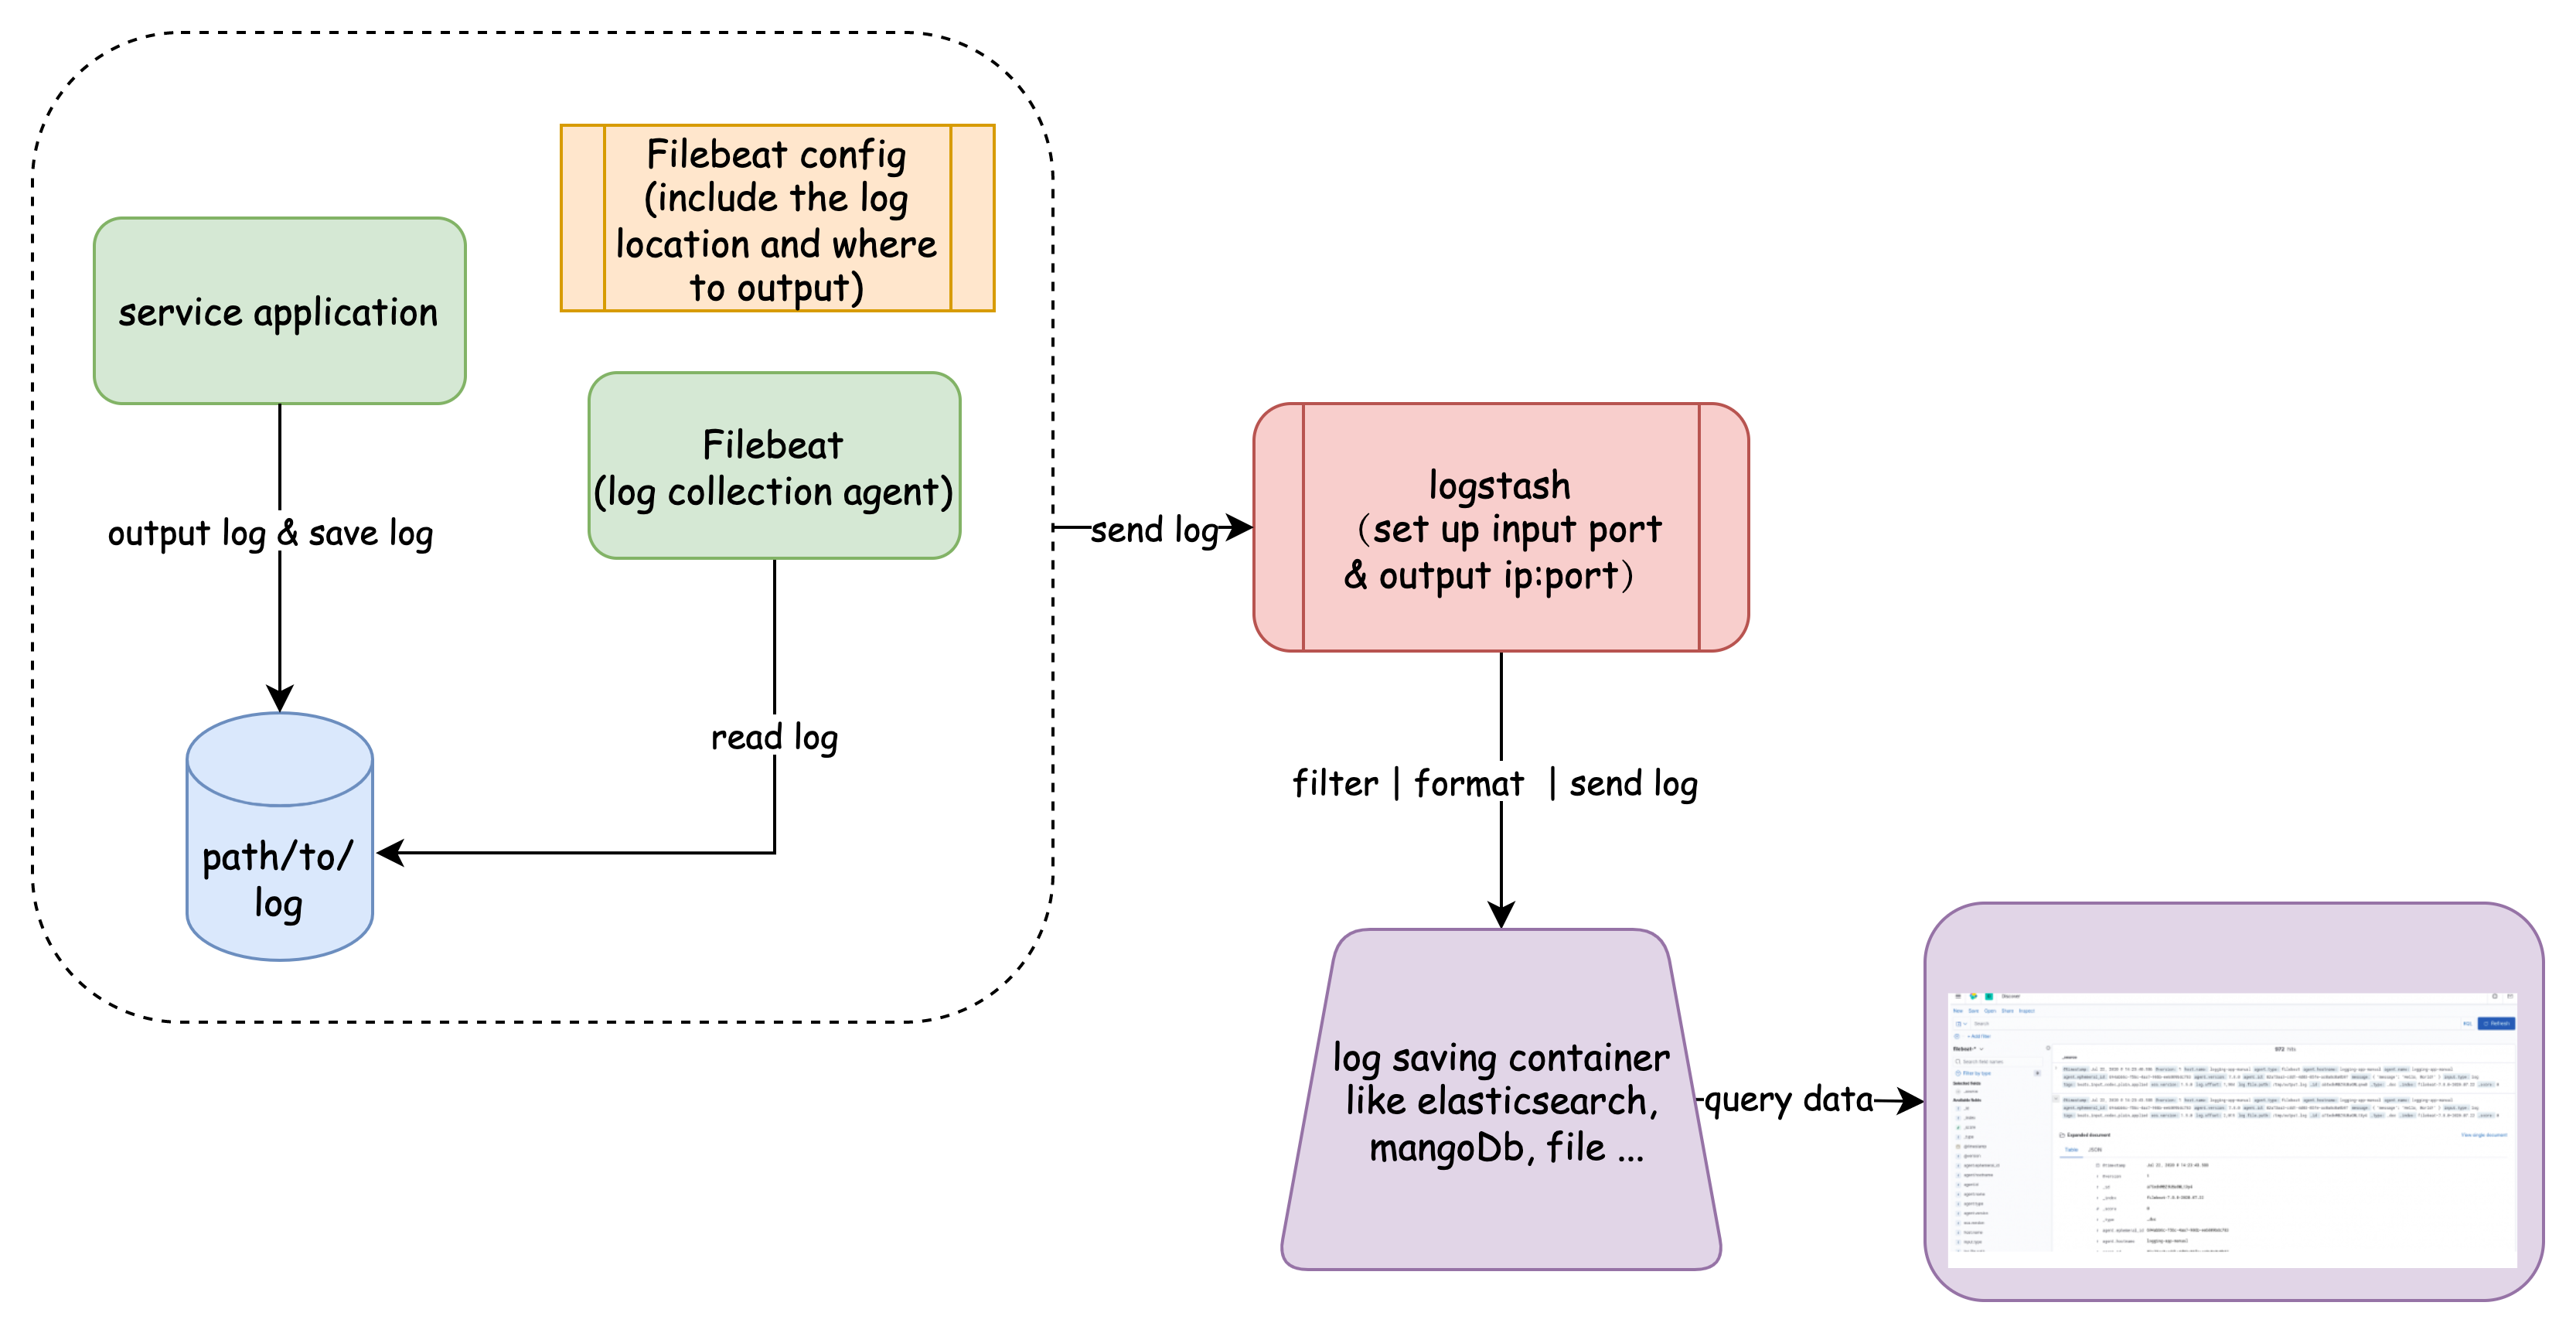
ELK is a framework which is provided by elastic stack organization. This framework can be divided into three parts. The heart, ElasticSearch collects data and is also a data searching engine, which can provide and save data. It can be deployed onto k8s cluster and execute scalation automatically. Then, logstash is used to format log and send collecting data to ElasticSearch, like a pipeline. In the end, kibana is used to visualize the data from ElasticSearch. What’s more, a log collecting tool, beat (Filebeat) also needs to be set up for a collection application log and send the log to logstash. And the whole workflow can be presented as the Pic1.
EFK ElasticSearch fluentd kibana
EFK is another log framework and some features are similar to ELK. EFK includes a log agent, fluentd for collecting log data and sending log data to ElasticSearch. EFK is supported two endpoints which are Stackdriver Logging for use with Google Cloud Platform and ElasticSearch. Fluentd is a DeamonSet k8s resource which can be deployed into k8s Nodes as a Deamon Pod. This special pods will collect the log of the pods in the same Nodes. Therefore, EFK just needs to deploy ElasticSearch Pods, kibana interface Pods, fleuntd DeamonSet.
How to use
ELK
Deploy ElasticSearch engine in k8s
- add es-manual.yaml file which includes k8s deployment configuration and service configuration. Service file is used to expose es-manual pod. Then other services can access to ElasticSearch service freely. If you want to run es deployment in your local machine, you might specify the “discovery.type” is equal to “single-node”. The default discovery.type for ElasticSearch is multi-node. If es was set as a multi-node cluster, it would discover other nodes. Therefore, some discovery configurations need to be set up. Otherwise, you will get the following errors.
1 | ERROR: [1] bootstrap checks failed |
When everything of es is set up correctly, you can input
curl http://localhost:<expose port>in your iTerms, the following result you will receive:1
2
3
4
5
6
7
8
9
10
11
12
13
14
15
16
17{
"name" : "es-manual-ccd547885-4czd4",
"cluster_name" : "docker-cluster",
"cluster_uuid" : "WbVh_VIjS42ppWYuGwovog",
"version" : {
"number" : "7.8.0",
"build_flavor" : "default",
"build_type" : "docker",
"build_hash" : "757314695644ea9a1dc2fecd26d1a43856725e65",
"build_date" : "2020-06-14T19:35:50.234439Z",
"build_snapshot" : false,
"lucene_version" : "8.5.1",
"minimum_wire_compatibility_version" : "6.8.0",
"minimum_index_compatibility_version" : "6.0.0-beta1"
},
"tagline" : "You Know, for Search"
}
Deploy kibana in k8s
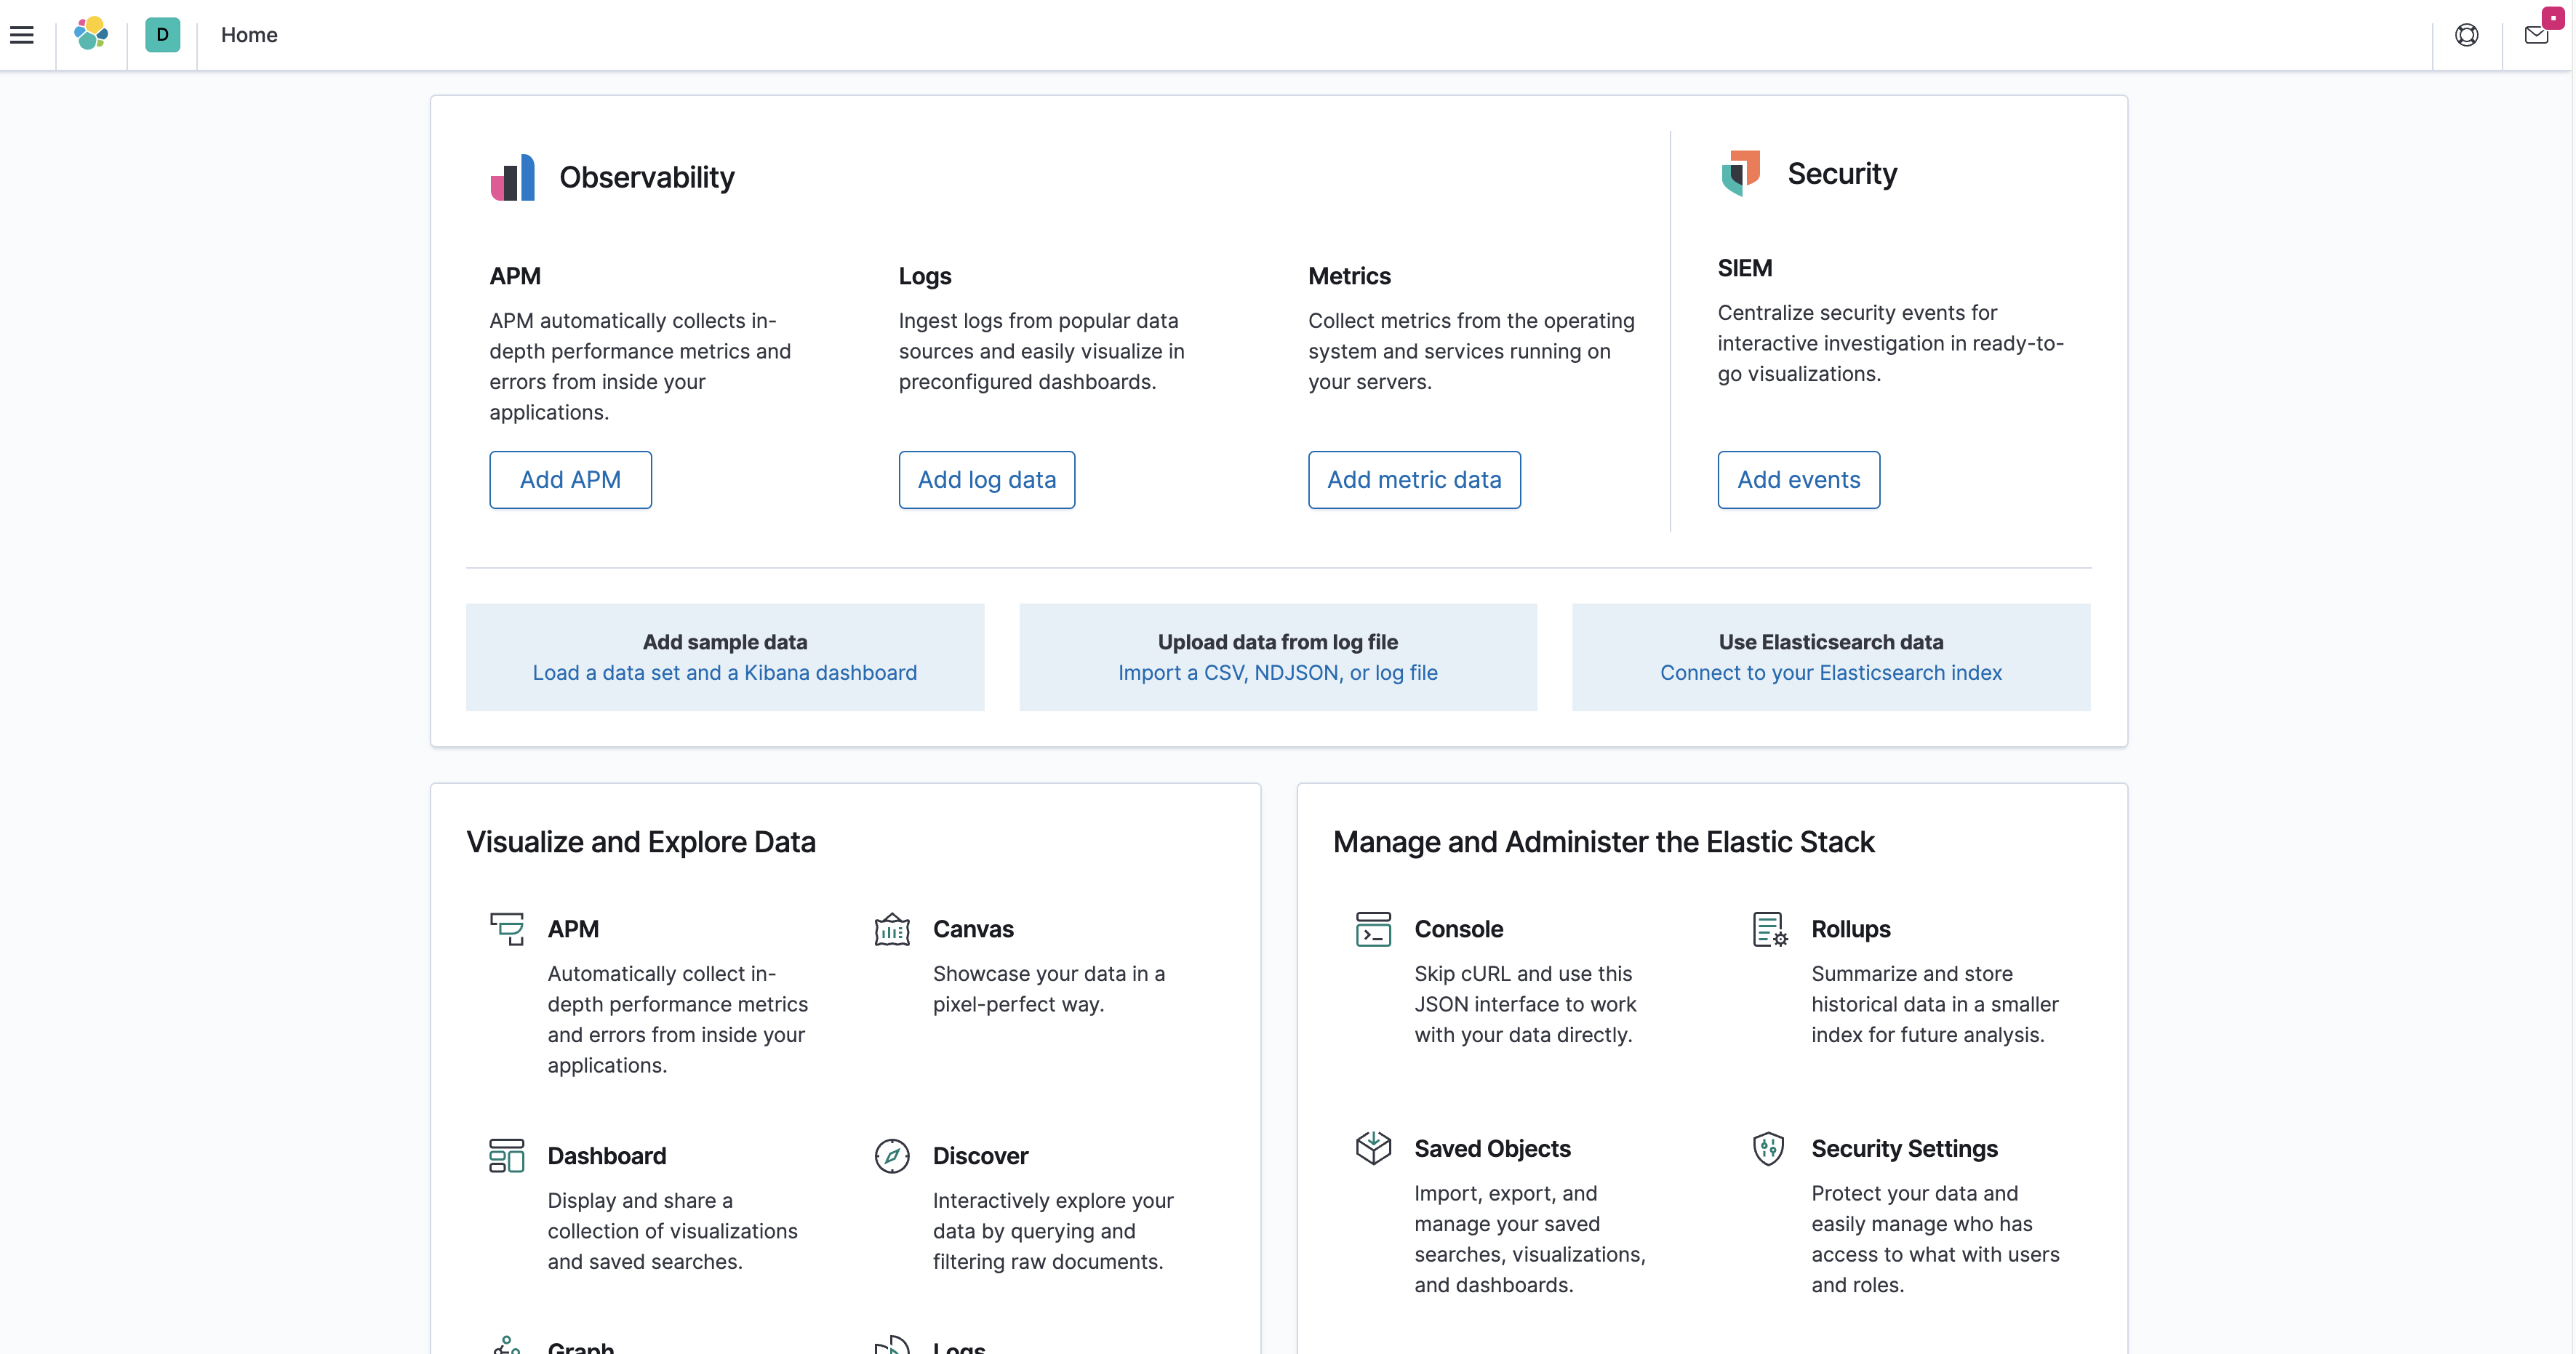
- Add a kibana deployment manifest including deployment image and service information. Meanwhile, the ElasticSearch exposed url should be added into the k8s container as an environment variable. Like, ElasticSearch_HOSTS. After successfully deploying, command
curl http://localhost:32184/statuscan be used to check if kibana is ready or not. What’s more, you also can utilize k8s service name as hostname with target port to communicate with es pods. When kibana runs up, the following pic can be shown after you access tohttp://localhost:32184on your browse:
Deploy logstash in k8s
add logstash k8s manifest file and configuration file. Based on the first file, we can deploy logstash service in k8s cluster. In the second file, we will define the input and output of the data. logstash.config will be defined as a k8s configMap resource. Then deployment will volume the configMap into k8s pod, which can be used by logstash service.
- input the following command to create ConfigMap
1
kubectl create configmap logstash-config --from-file ./logstash.conf
- create deployment
- after logstash starts up, we can input
kubectl logs <pods name> -ffor obtaining useful log data.
1
2
3
4
5
6[2022-05-13T08:18:20,309][INFO ][logstash.outputs.ElasticSearch][main] Installing ElasticSearch template to _template/logstash
[2022-05-13T08:18:21,040][INFO ][logstash.inputs.beats ][main] Beats inputs: Starting input listener {:address=>"0.0.0.0:5044"}
[2022-05-13T08:18:21,057][INFO ][logstash.javapipeline ][main] Pipeline started {"pipeline.id"=>"main"}
[2022-05-13T08:18:21,150][INFO ][logstash.agent ] Pipelines running {:count=>1, :running_pipelines=>[:main], :non_running_pipelines=>[]}
[2022-05-13T08:18:21,194][INFO ][org.logstash.beats.Server][main][be216883a18a1108d5ceab3d012b51b20564d3e53d37fdaf62f0441690df42ff] Starting server on port: 5044
[2022-05-13T08:18:21,439][INFO ][logstash.agent ] Successfully started Logstash API endpoint {:port=>9600}- input the following command to create ConfigMap
Deploy Filebeat and Log generating application
In the end, we will deploy the log collector sidercar, Filebeat. It will collect log data from a sharing log file and send the data to the logstash. At first, we need to define filebeat manifest, which will illustrate where the filebeat reads the log and where the log is sended. You can input the command to create configMaps for filebeat configuration
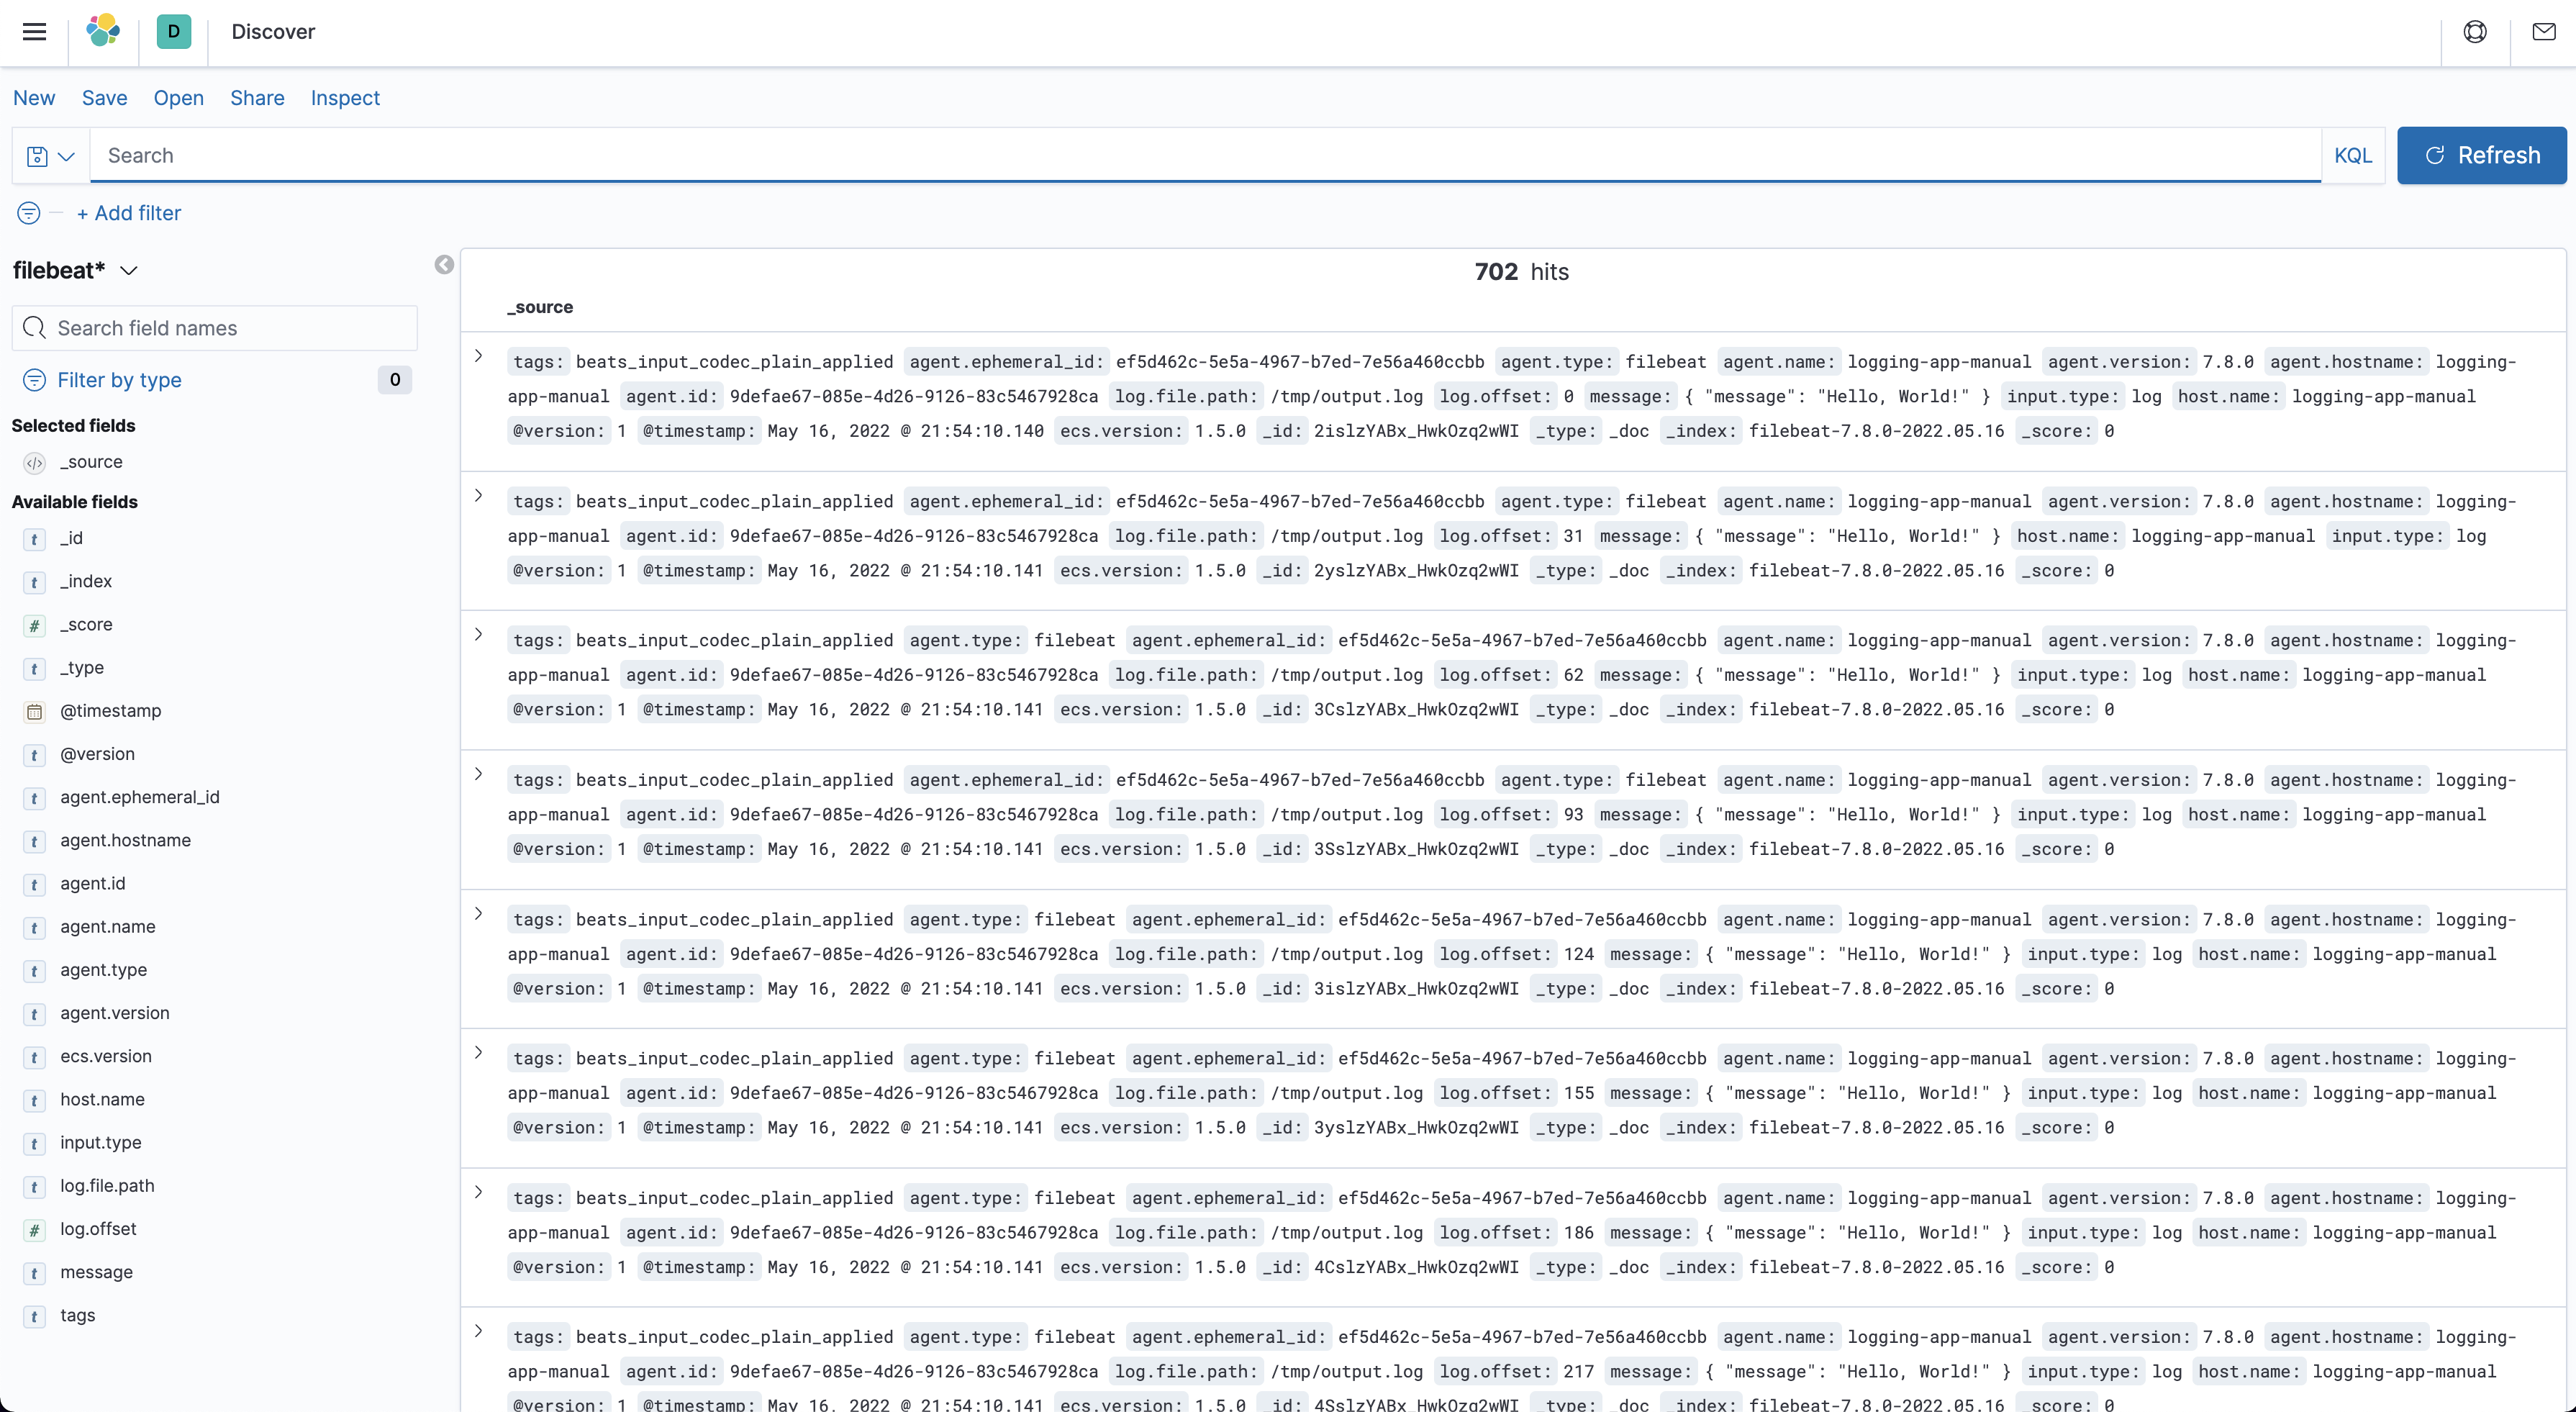
kubectl create configmap file-beat-config --from-file ./filebeat.yml. Then this configuration will be volumed into pods. When you deploy the log generator application and filebeat application. Then logstash will receive log data from being listened port. To check if the log system works normally or not. You can open your browser and inputhttp://localhost:32184/, kibana GUI will represent to you as follows pic3. In order to see the log information, a Index Pattern needs to be created first.- how to create “Index Pattern”
- open kibana dashboard
- click stack management
- click index pattern
- create new index pattern like filebeat*, index is defined in the logstash.conf file
- how to create “Index Pattern”
At here you have learned how to make a ELK log system on your application.
EFK
Deploy ElasticSearch
- The same as the former ElasticSearch deployment manifest
Deploy kibana
- The same as the former Kibana deployment manifest
Deploy fluentd
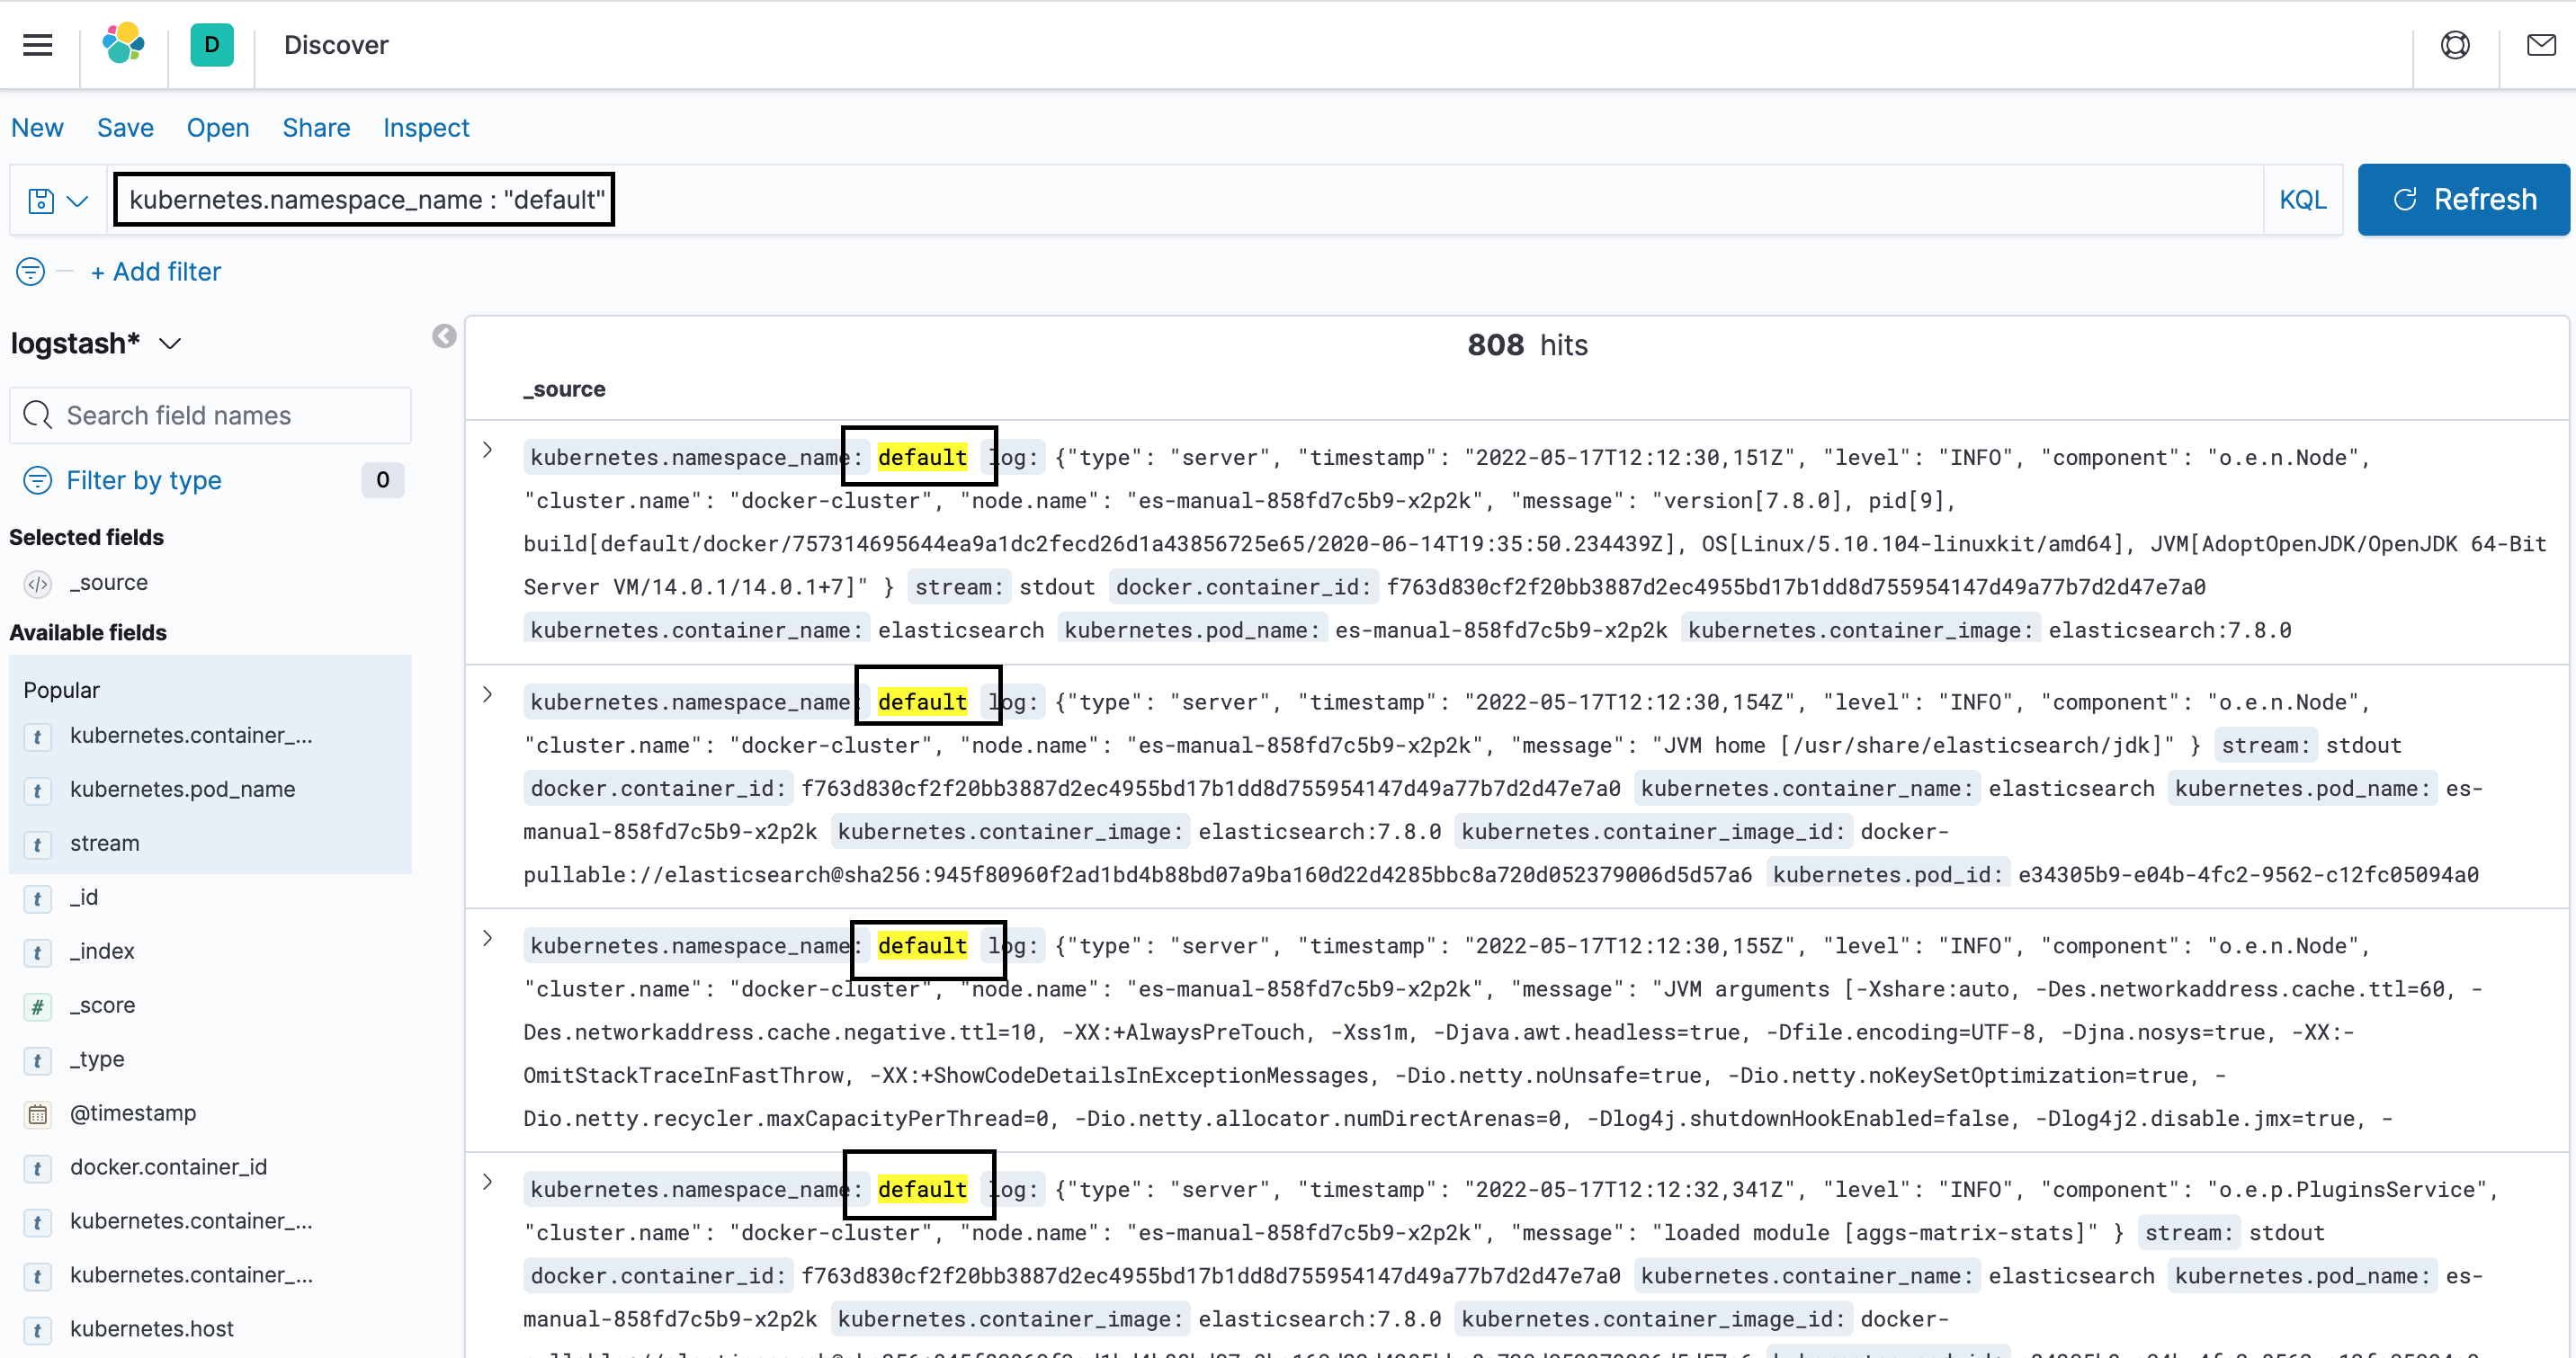
At here, we will define a DeamonSet manifest to deploy fluentd which deploy a Pods for collecting the Pods log and docker container log. If everything is set up correctly, you will see the following pic after input KQL
kubernetes.namespace_name : "default".Here is some information about the resource DaemonSet from kubernetes official website
- A DaemonSet ensures that all (or some) Nodes run a copy of a Pod. As nodes are added to the cluster, Pods are added to them. As nodes are removed from the cluster, those Pods are garbage collected. Deleting a DaemonSet will clean up the Pods it created.
Deploy business service application
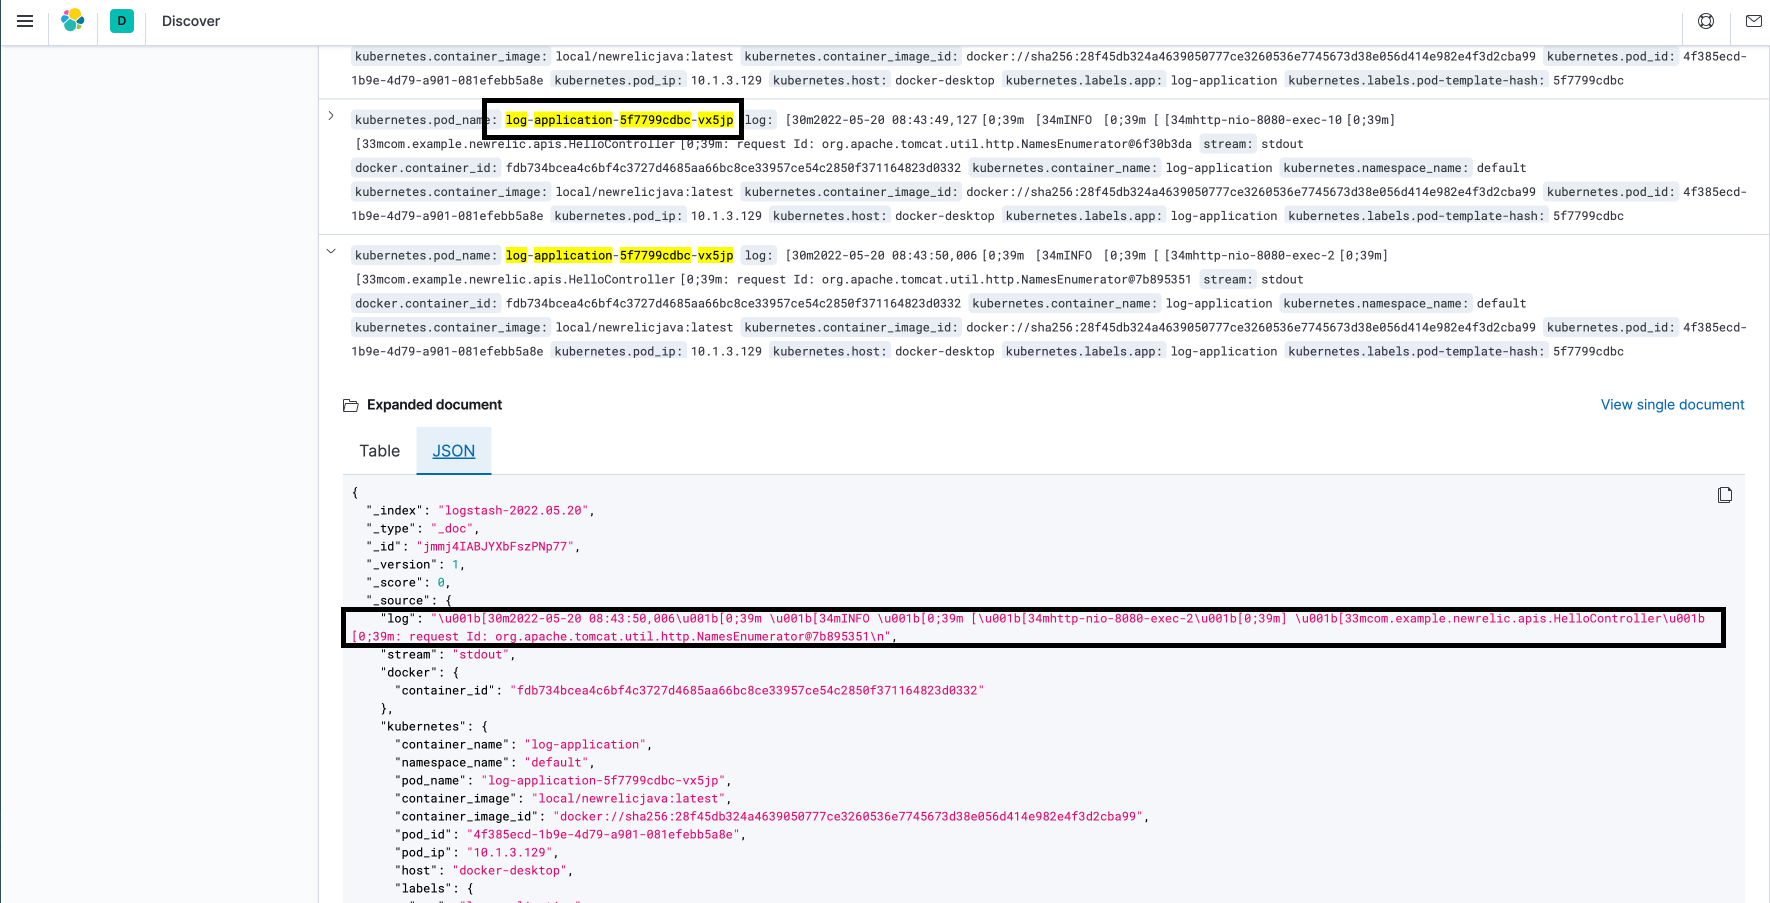
- In our daily delivery, we always deploy our application in k8s. Take log-application.yaml as an example, we use slf4j.Logger to print log on the application console. When a request hits the log-application, it will print its stdout on the console, which will be scanned by fluentd and it will send the log data to ElasticSearch. The following picture pic5 will be represented.
How difference between them
- Components
- For this part, it is very obvious that ELK is composed of ElasticSearch, Logstash, filebeats and Kibana. However, EFK just includes ElasticSearch, fluentd and Kibana.
- Mechanism
- In ELK framework, the core feature is the logstash used as a log sending agent. Logstash just likes a log transportation center which can re-process the format, filter and enrichment of logs. It’s very memory-consuming. We can’t deploy a logstash into a container with other logging applications. Therefore, filebeat, a lightweight log collector, works as a log agent to send log to logstash.
- In EFK framework, fluentd is the core feature. fluentd is deployed on k8s cluster as a DeamonSet resource, which can collect the node metrics and log. And it doesn’t need another log transportation agents. Only if fluentd is set with enough permission, the container and nodes log can be collected directly.
- log agent performance
- logstash is written by JRuby and runs on JVM.
- fluentd is written by CRuby, which consumes less memory than logstash.
- Configuration
- logstash
- You can add your own manifest to set up input and output rules, log format, etc.
- fluentd
- fluentd UI browser (Install, uninstall, and upgrade Fluentd plugins)
- Dockerfile
- logstash
- Usage scenarios
- For ELK, it needs more memory. Therefore, logstash might not be suitable for the low-memory machine. On the other hand, EFK just consumes less memory. In my opinion, EFK might have a wide range of applications.
- More information
- If you want to get more comparison information, you can take the following references a look.
- Difference Between Fluentd vs Logstash
- Kubernetes Logging: Comparing Fluentd vs. Logstash
- Fluentd vs. LogStash: A Feature Comparison
Conclusions
According to this article, two popular log frameworks, ELK&EFK are introduced to you. Nowadays, application system is significant to our daily development, production troubleshooting, and product issue back-track for finding root result. What’s more, with the log platform generating, several advantages comes up to my mind:
- log-centralized, with the above two log frameworks, the log of application, docker container and nodes cluster are gathered into one place. As log centralizes, our debugging becomes more and more easy.
- real-time, log agent, logstash and fluentd will almost send system logs to ES in real-time. Because of their real-time file content and port listening, we can obtain real-time log feedback for online issues troubleshooting.
- visualization&analysis, providing KQL for querying data and drawing charts. Providing lots of categories of charts can help us do some analysis.
- open-resource and active communities for supporting unknown issues
In the end, all the manifests are provided in my github
- Title: how to set up your log system
- Author: Xiao Qiang
- Created at : 2023-03-05 15:04:56
- Updated at : 2025-08-06 15:16:17
- Link: http://fdslk.github.io/tech/ops/log/2023/03/05/ops-log-management/
- License: This work is licensed under CC BY-NC-SA 4.0.